This tutorial shows you how to get setup using Webstorm to debug your AWS Lambdas locally. More tutorials to come for other IDEs (though the basic approach is the same :-)).
Using this, you can run AWS Lambdas directly on your machine, and step through the actual Lambda code to debug it with real requests and responses.
Prerequisites
- Bespoken Tools (bst)
- Install bespoken-tools as part of your project
npm install bespoken-tools --save-dev
- WebStorm
These examples are based on a simple sample project. If you want to use the same, just clone this repo:
git clone https://github.com/bespoken/lambda_samples
Of course, feel free to use your own existing Lambda project.
Configuring WebStorm
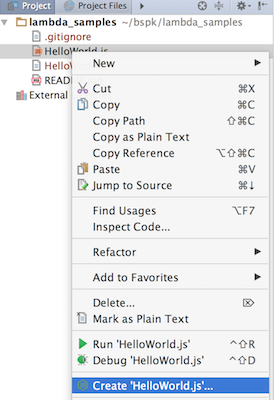
From your AWS Lambda project in WebStorm, right-click on the Lambda JS file and select 'Create <LambdaFile.js>':

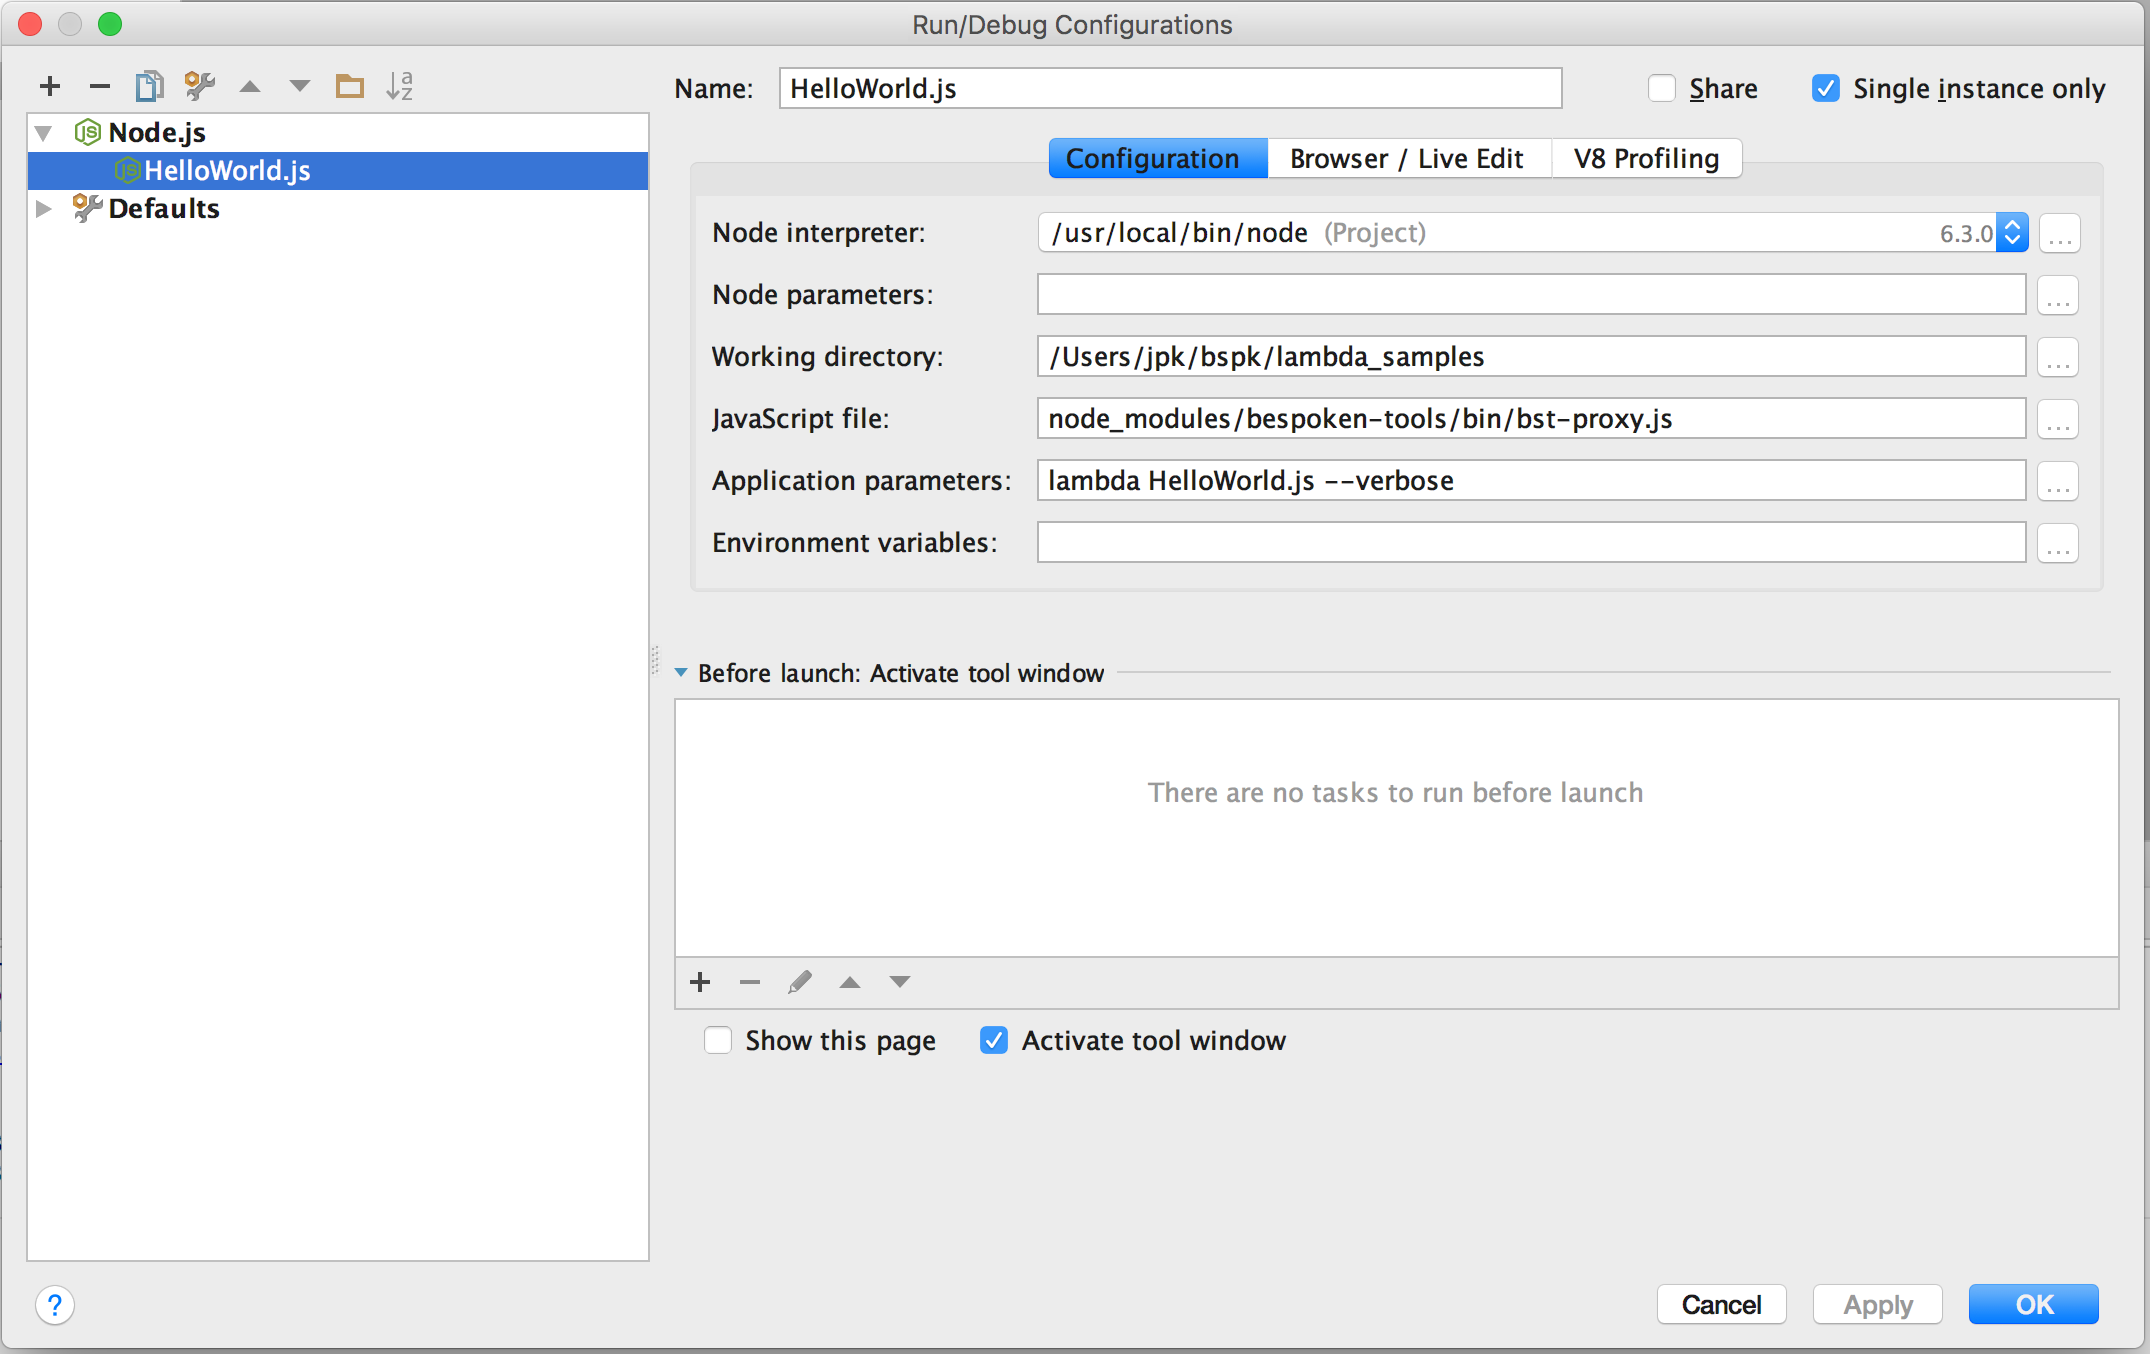
Fill out the configuration:

Make sure the JavaScript File is set to:
node_modules/bespoken-tools/bin/bst-proxy.js
Set the application parameters with 'lambda' followed by the filename of the Lambda entry-point:
lambda <LambdaFile.js> --verbose
(The --verbose parameter prints out helpful information to the console).
Select 'OK' to save the configuration.
To start debugging, click on the little bug icon next to the configuration at the top:

Seeing It In Action
We will use a simple curl to send a request to the service:
curl -H "Content-Type: application/json" \
  -X POST \
  -d '{"key1":"value1","key2":"value2", "key3": "value3"}' \
  http://localhost:10000
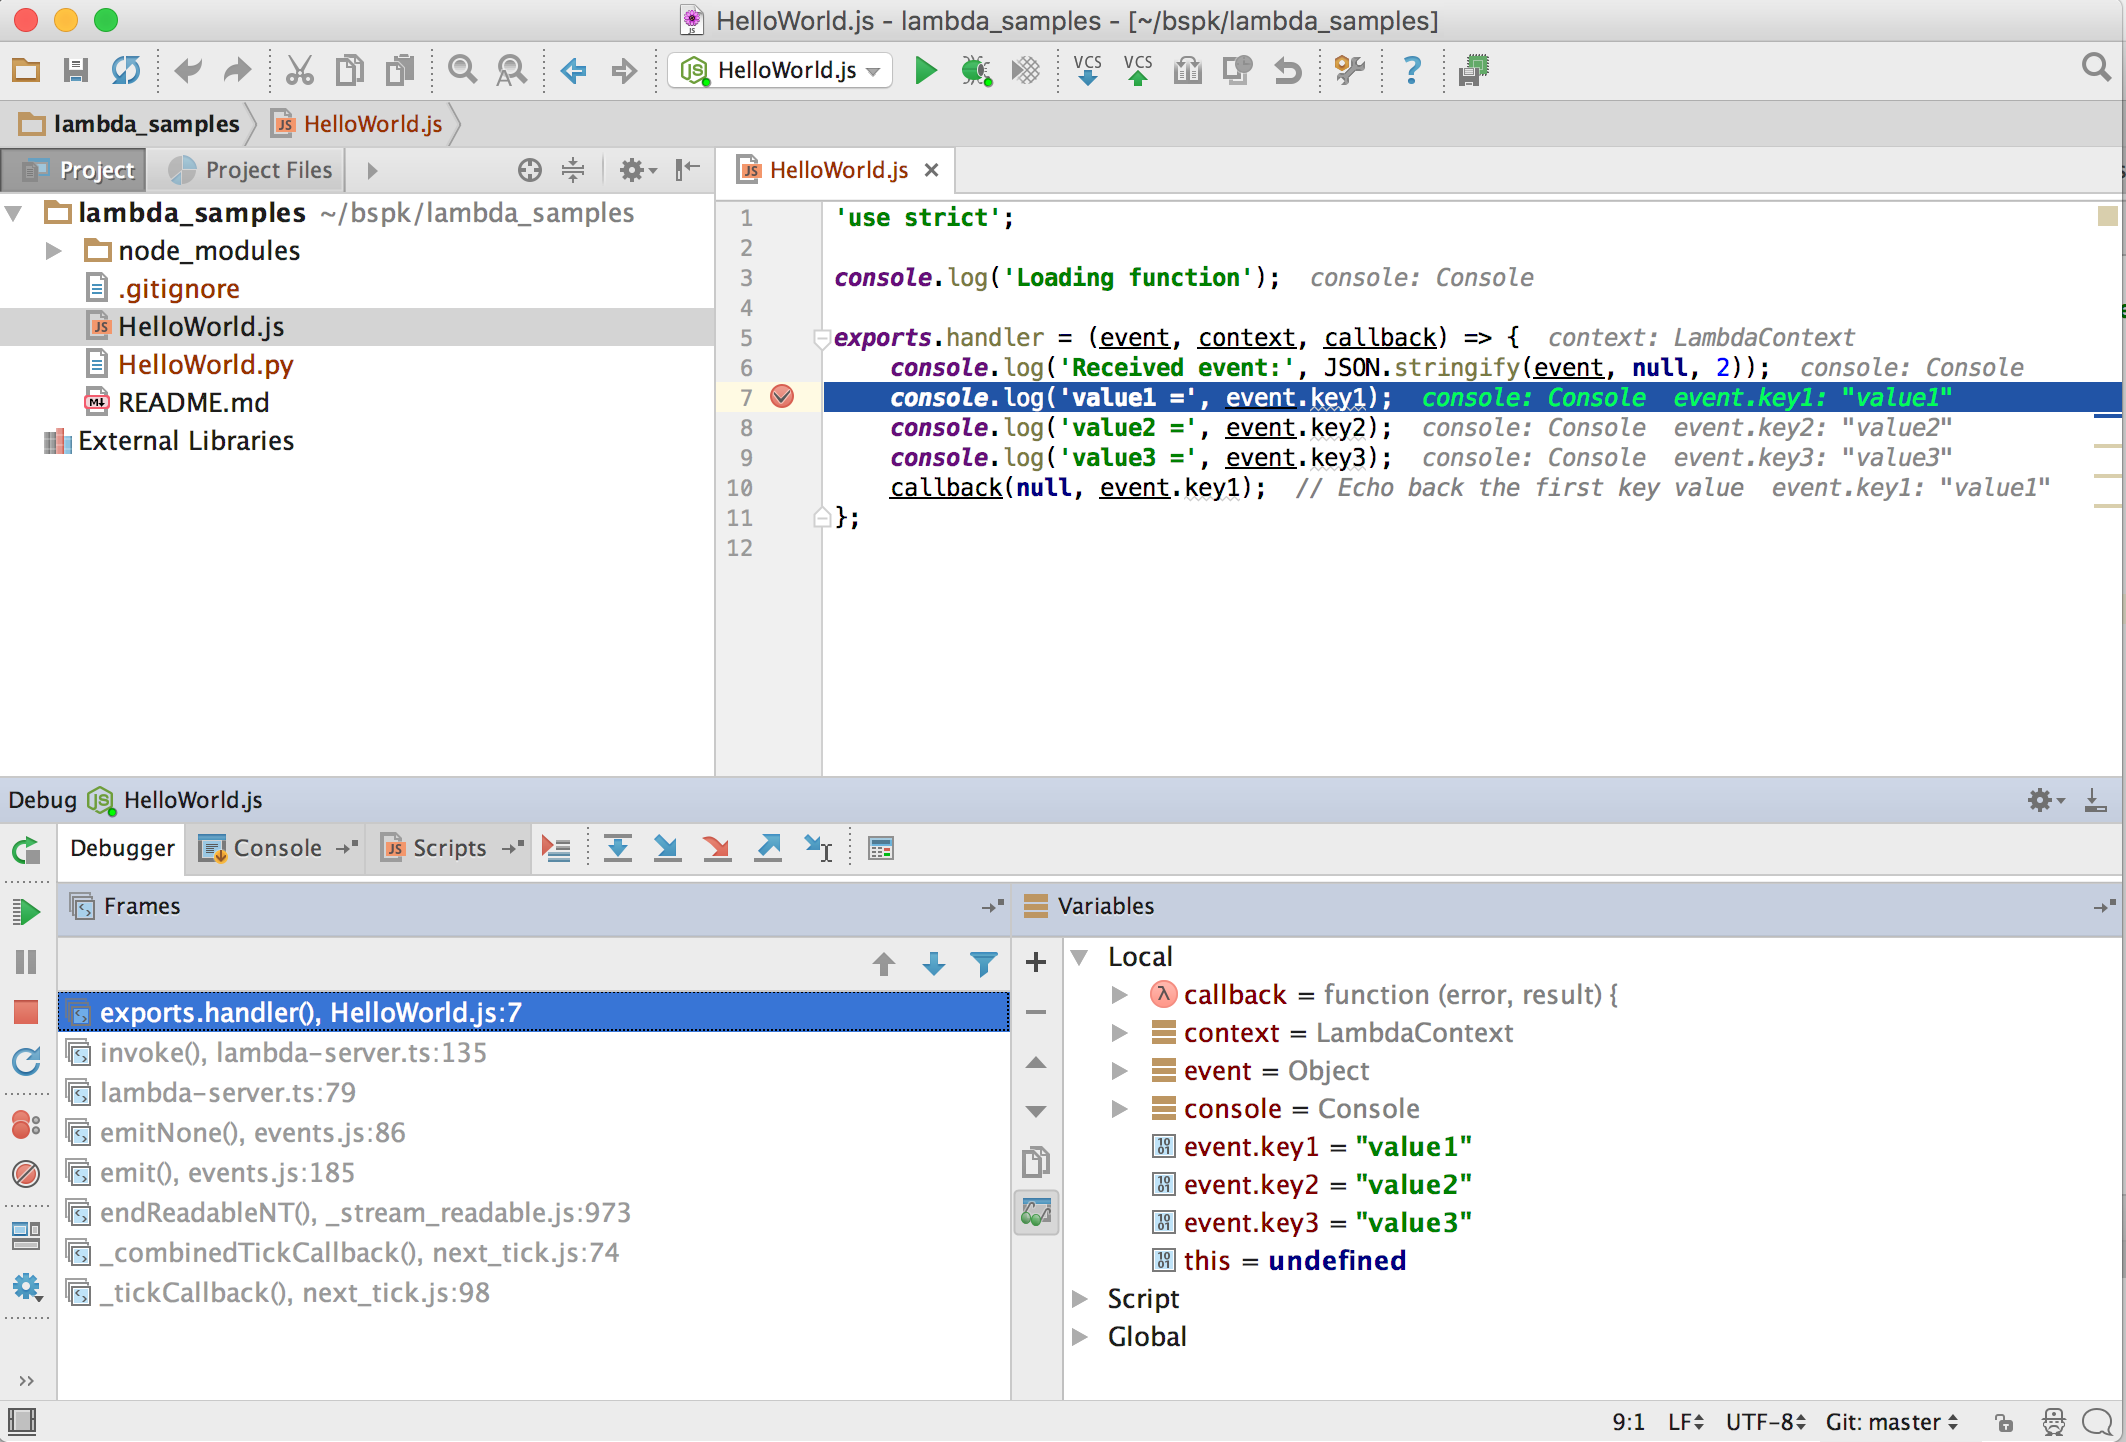
With a breakpoint added at Line 7, here is what you will see:

Lots of great information, right? WebStorm offers a host of capabilities via their debugger - you can learn more here.
We hope this helps accelerate how you develop and debug with Lambdas.